Supplemental research · interactive deck
AI progress came in waves, not a smooth line.
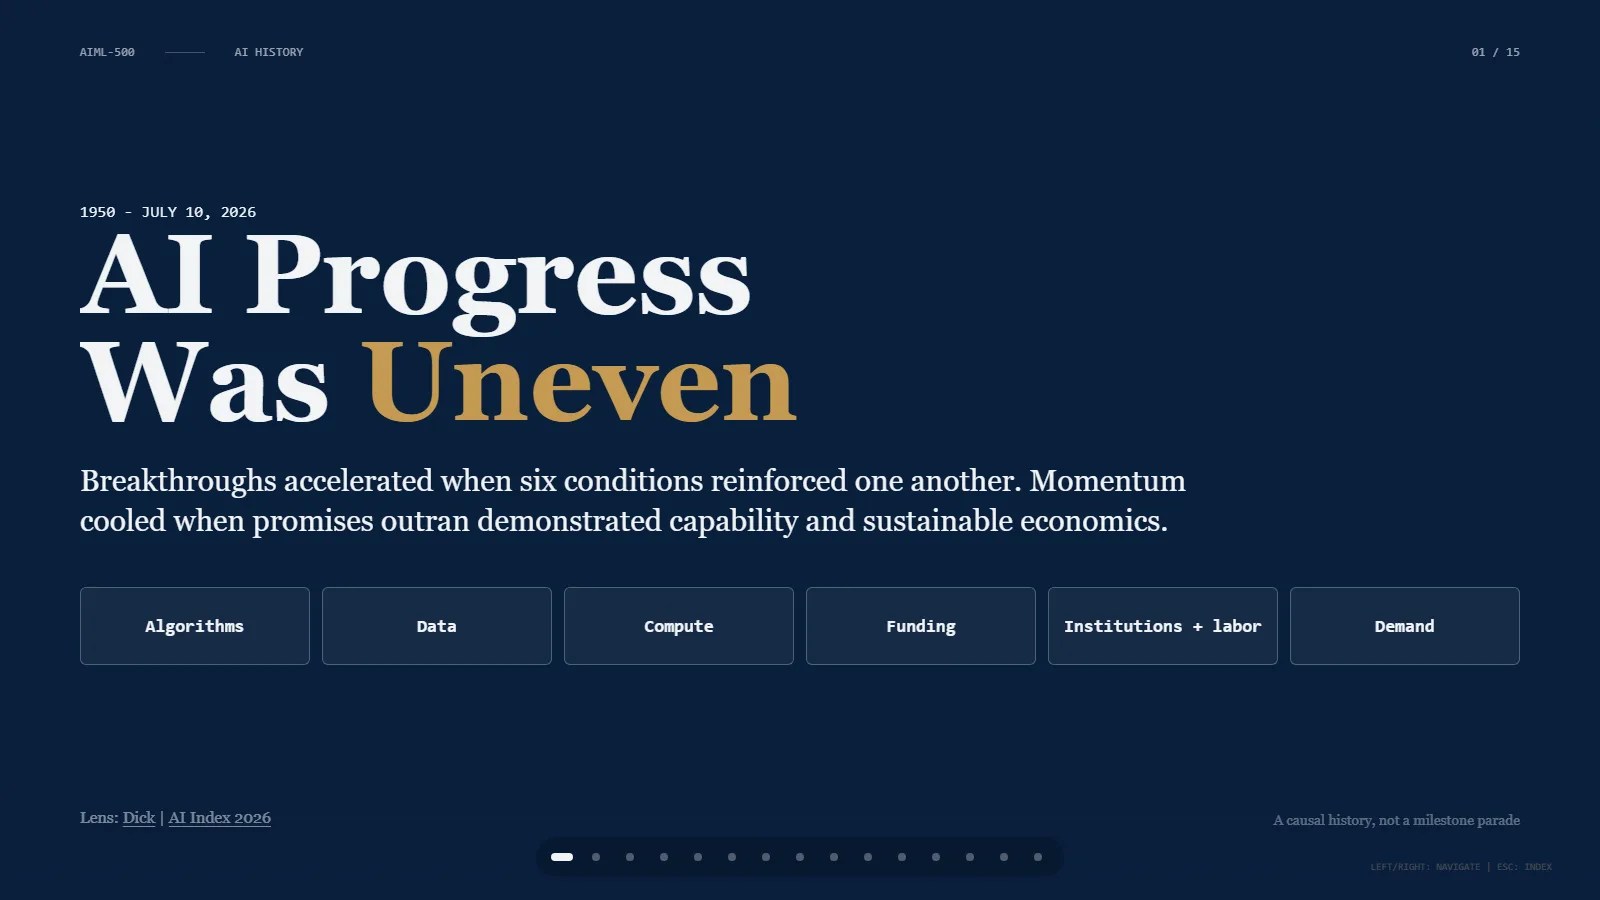
This self-paced companion gives newcomers a route through seventy-five years of AI history. Instead of presenting milestones as a list of dates, it asks what changed when research methods, data, computing power, funding, institutions, and practical demand began to align. A master timeline and four era summaries connect breakthroughs with the conditions that enabled them—and with the limitations that produced setbacks.
I separated publication, demonstration, and adoption dates before choosing the milestones with the strongest supporting evidence. The resulting 15-slide experience is designed for independent exploration with Next and Previous controls, arrow keys, and an overview mode. The inline frame is deliberately hidden on small screens, where the five-image gallery and full-screen link provide a more readable route.
A visual explanation of why a breakthrough mattered, what made it possible, and what followed.
Self-paced: click Next or use arrow keys. 15 slides, about 10 minutes.
Mobile fallback · rubric evidence
Era snapshots
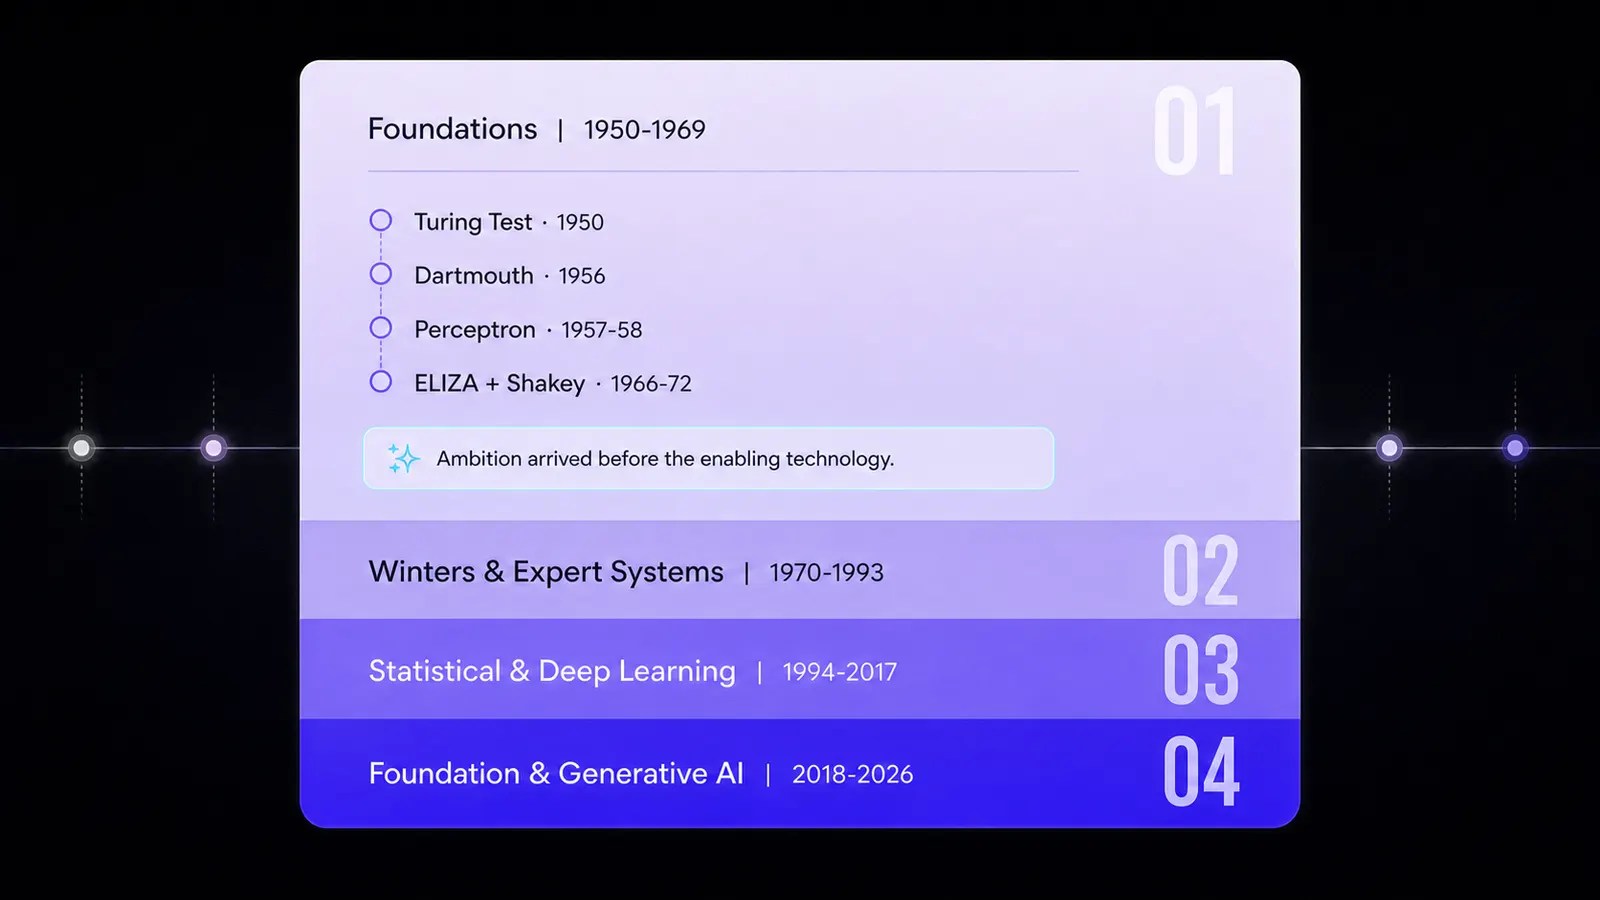

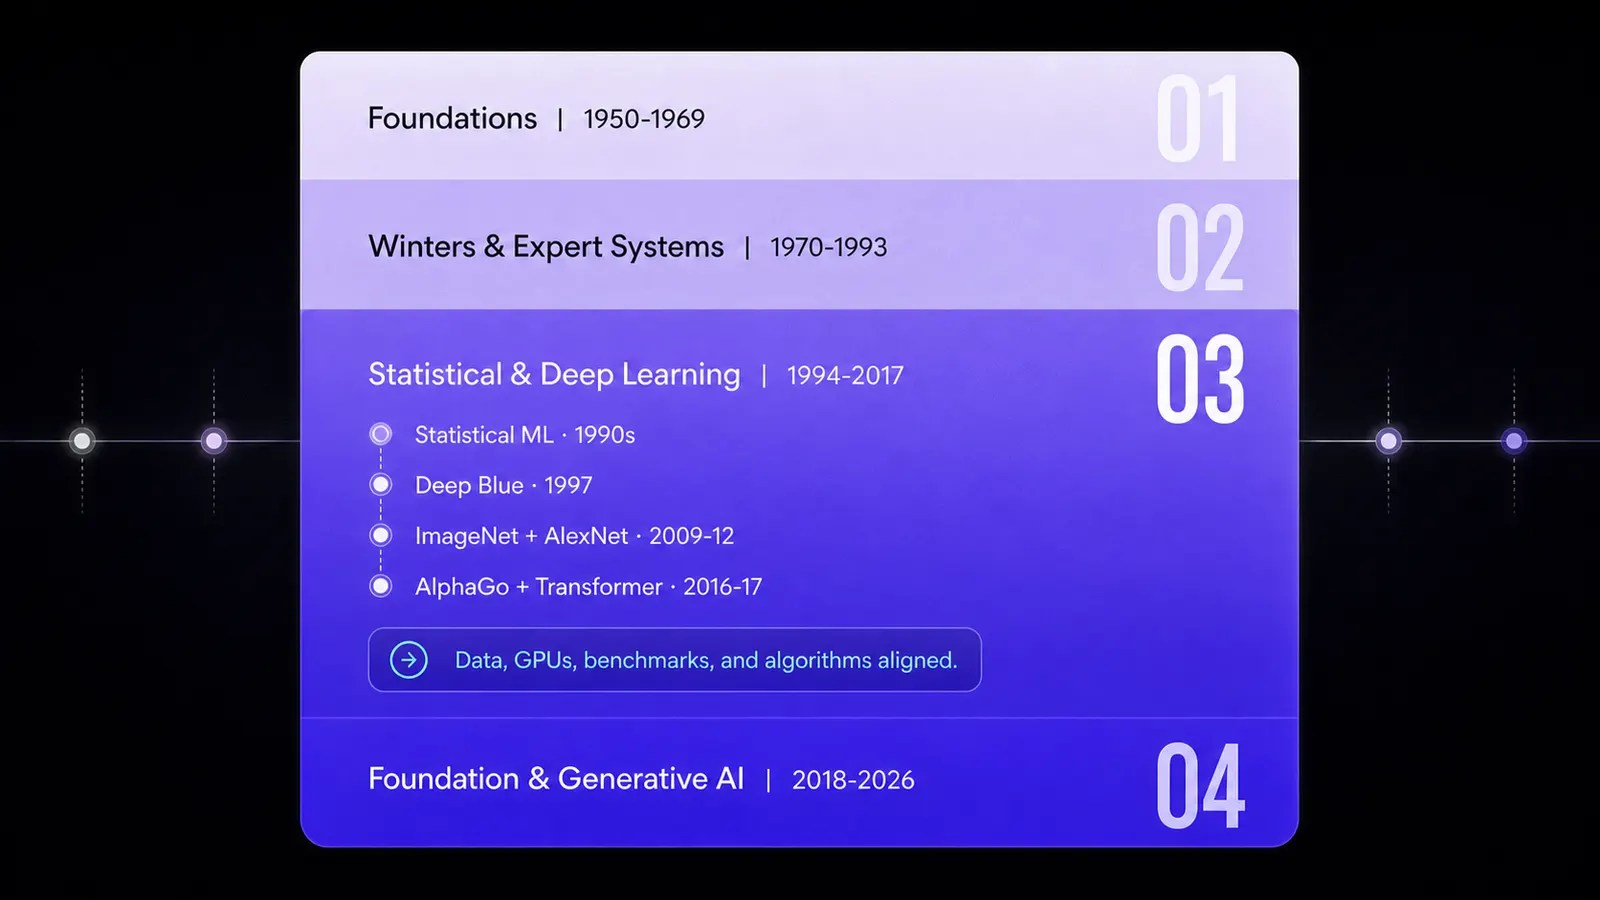
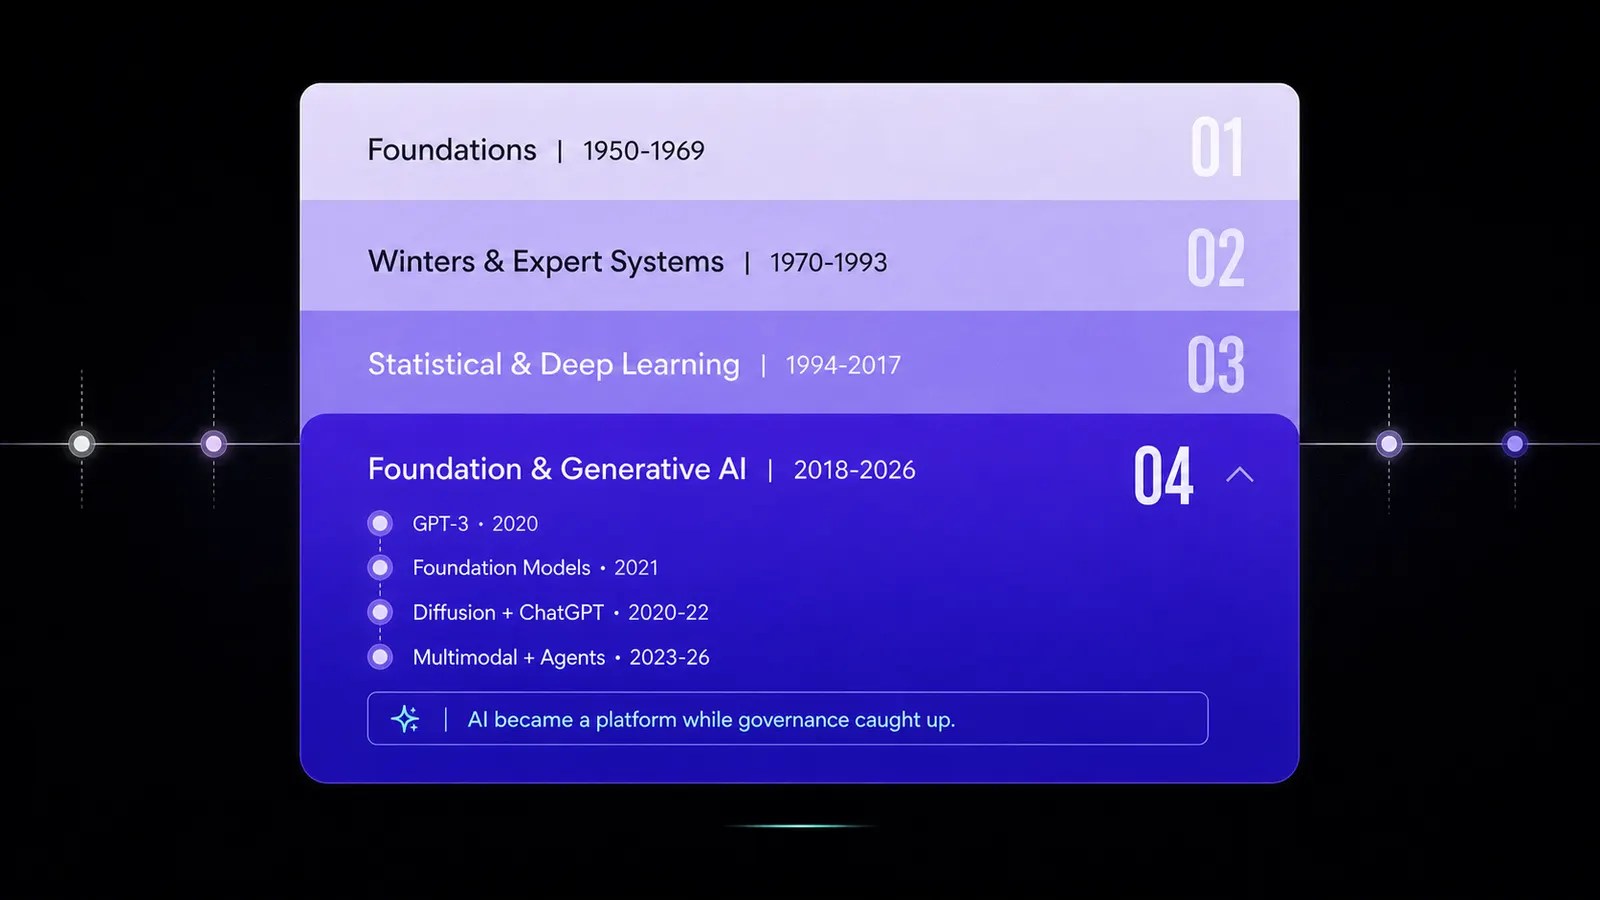
At a glance
Introduction
I created this companion for newcomers who need a clear route through seventy-five years of AI history.
Description
The presentation follows four eras, from early rule-based programs to generative AI, using a master timeline and four visual summaries.
Objective
Test whether AI progress accelerated when research, data, computing, funding, institutions, and practical demand aligned.
Process
Separate publication, demonstration, and adoption dates; select evidence-backed milestones; group them into eras; connect enablers and setbacks.
Tools
HTML, responsive CSS, original infographic assets, and a local motion library, with keyboard, touch, and on-screen controls.
Value Proposition
A learner can see why a breakthrough mattered, what made it possible, and what limitation or next step followed.
Unique Value
The timeline places algorithms, data, computing, funding, institutions, and demand on the same causal map.
Relevance
I built this supplemental AIML-500 resource independently to help newcomers connect milestones with enabling conditions.
Class context: Team 3 presented a separate artifact.
Artifact Access
References
The hosted presentation links the papers, institutional histories, datasets, and closing quotation used to support the timeline.